

Biography
Biography: Dave Anderson
Abstract
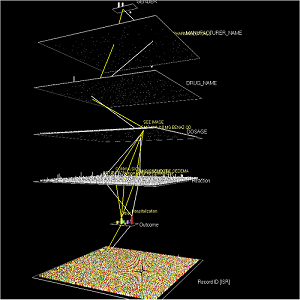
The exponential growth in digital data to support compound research, new drug development and clinical trials in advancing patient care provides distinct challenges to a clinical researcher. However, this also presents tremendous opportunities for new areas of exploration, cost savings and revenue growth to organizations that are willing to visualize their data in new ways. Size and complexity of clinical data matters, and unfortunately today’s visualization technology does not deliver the critical functionality for the researcher to quickly understand how data is connected and the dependencies between seemingly disparate data sets. Common dashboard visualizations do not provide the necessary context into how data is connected and what insights can be drawn based on these connections. The opportunity in order to meet the increasing board pressures to reduce cost and increase ROI, visual analytic tools must evolve to easily support all of the possible data available to researchers, including complex semi-structured, unstructured, and 3rd party data, and enable them to better understand which data is connected and how those data sets are related. This evolution provides the greatest opportunity for companies to use data in a more strategic way to improve value delivered to patients and shareholders. In this session, we will introduce and provide a software demonstration to show: How very large, dense, complex data sets can be quickly and efficiently integrated into a visual analysis program; a set of visualizations that explore the connections and dependencies across data sets; a new method to visually analyze data, enabling a deeper, contextual exploration of data and; How customers adopting this new method are realizing tremendous cost savings and improving their competitive position